
See what visitors do on your website.
Traffic, conversions, heatmaps and a grade for every page, in one dashboard. Simpler than Google Analytics. Set up in two minutes.
14 days free. No card. No cookie banner needed.
Everything you need to know about your site, nothing you don’t.
Visitors
How many people came, which pages they read and how long they stayed.
Conversions
Count quote requests, bookings, calls and sales, and see what drove them.
Traffic sources
Google, ads, social, email or ChatGPT. See which ones bring customers, not just clicks.
Clicks, tracked for you
Every button, link and phone number is tracked automatically. No tagging.
Heatmaps
See where people click and how far they scroll, including clicks on things that don’t work.
Page grades
Each page gets an A to F grade with the reason it’s losing people and what to fix.
Built for people who run a website, not analysts.
Small businesses
Find out if your site is bringing in calls and quotes, and which page is costing you leads.
Marketers
Know which campaign worked and prove it, without building reports in Google Analytics.
Agencies
Run every client site from one account and send each client a live dashboard link.
Here’s what it found on our demo site.
Fairweather Solar is a made-up installer with 30 days of traffic. Open the dashboard and look around.
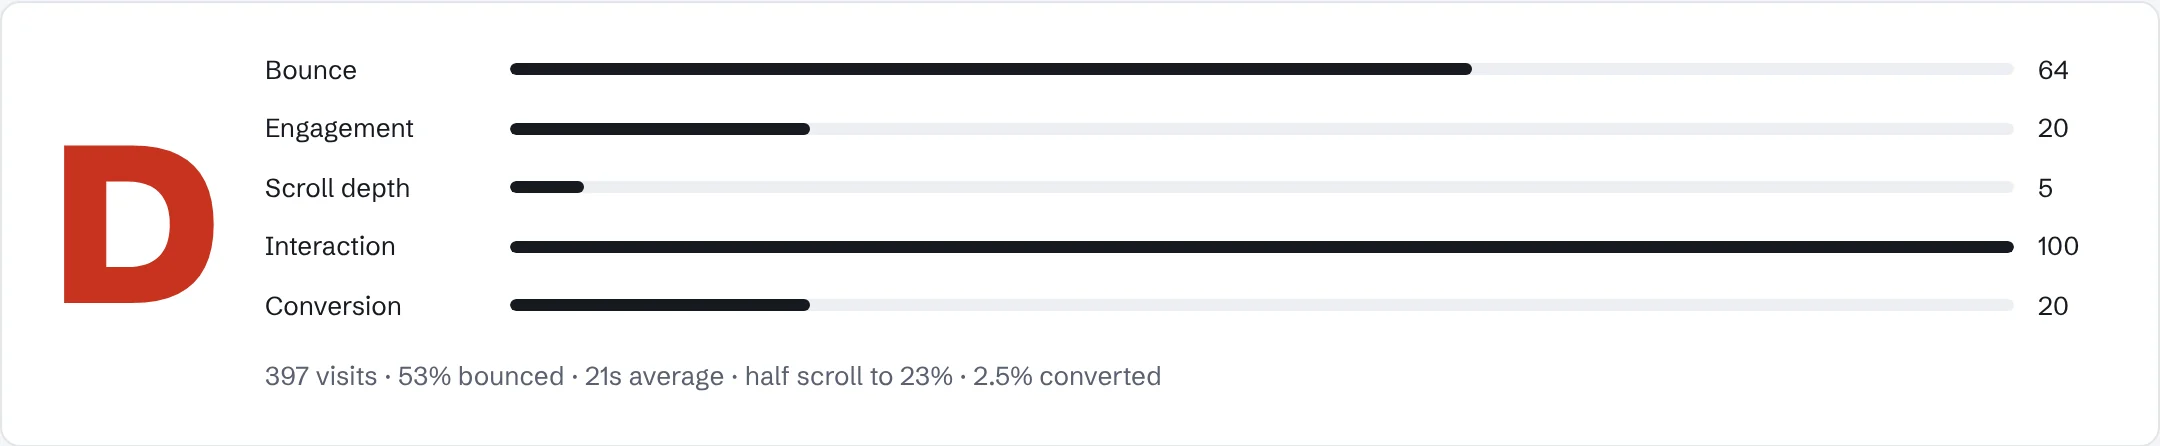
The financing page gets a D.
Half of visitors stop a quarter of the way down, before they reach the loan options. A teammate left a note with the fix.
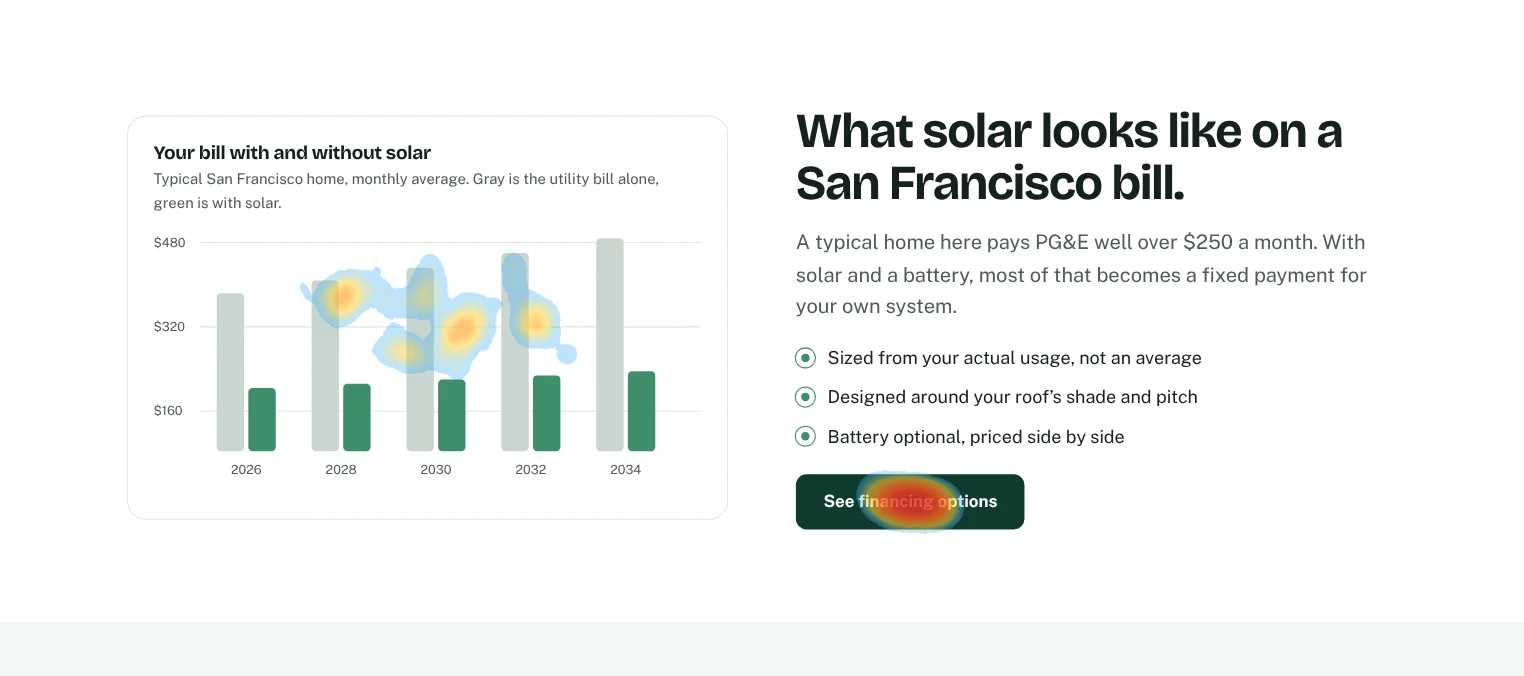
People keep clicking the savings chart like it’s a calculator. Can we make it one?
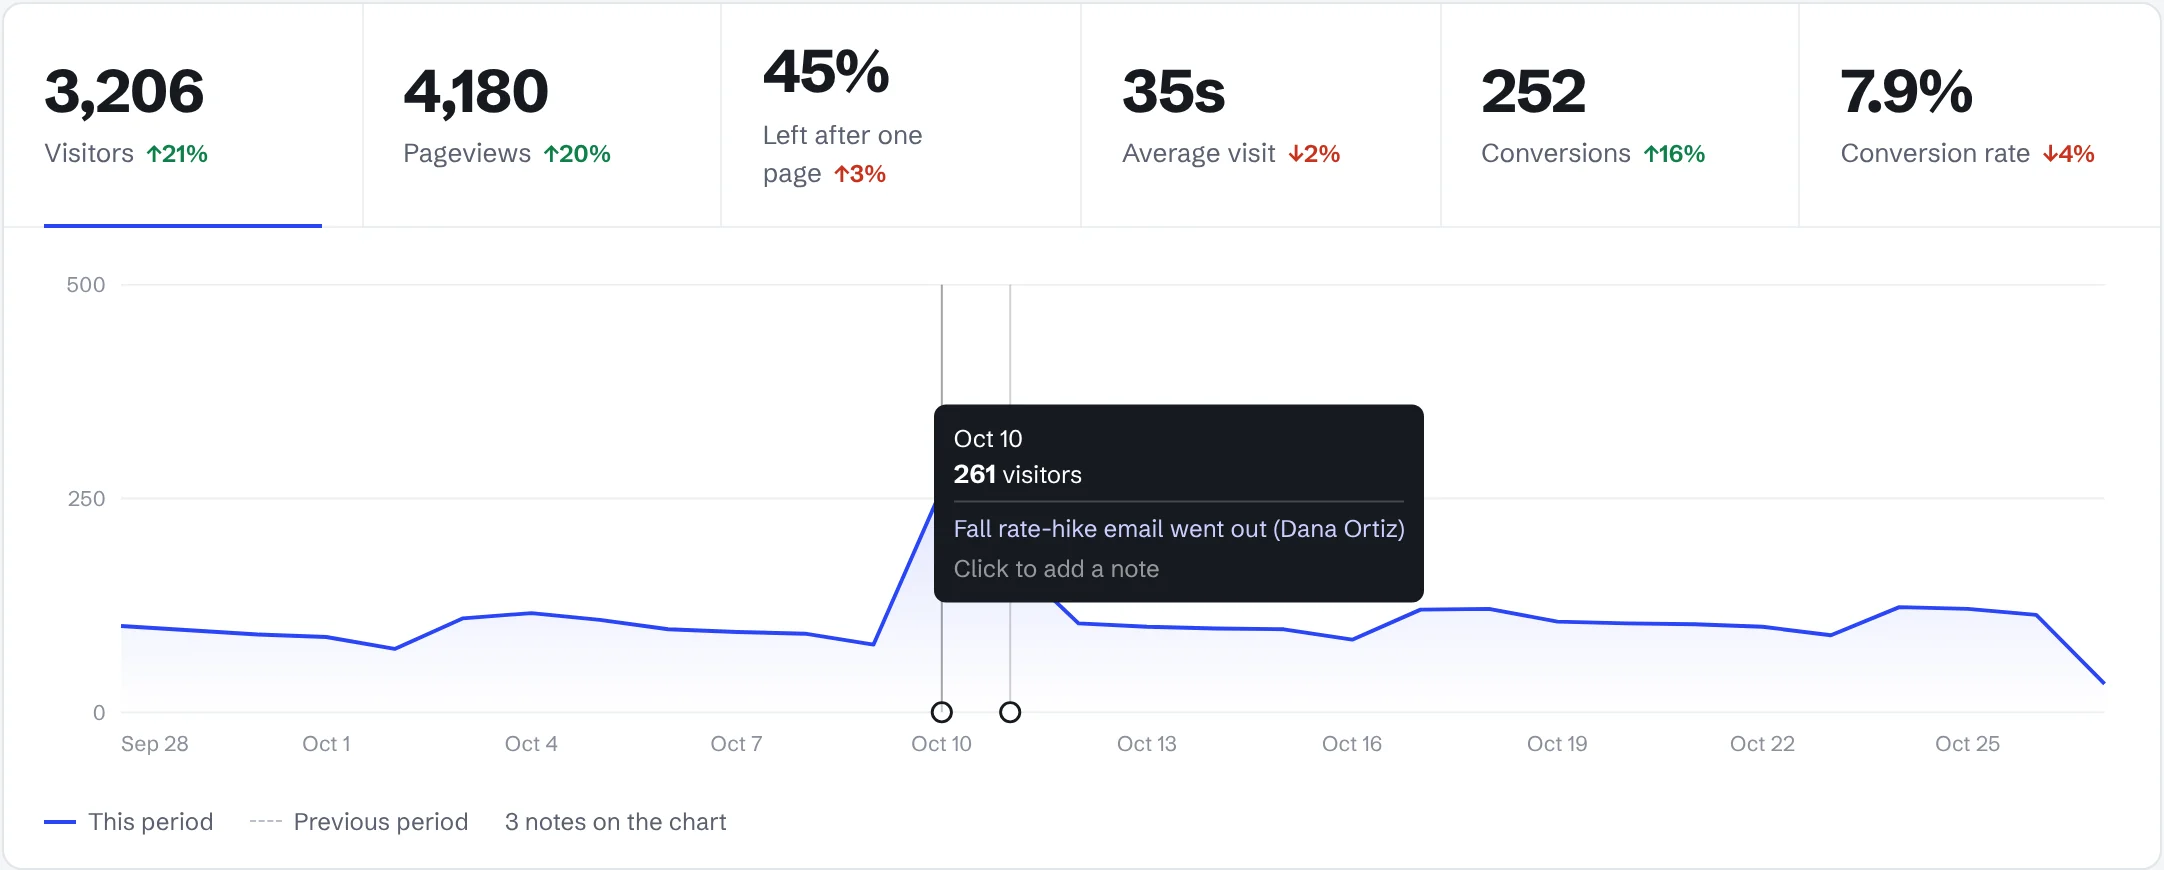
Traffic spiked on October 10.
The note on the chart says why: the rate-hike email went out that morning. Pin notes so nobody has to guess later.
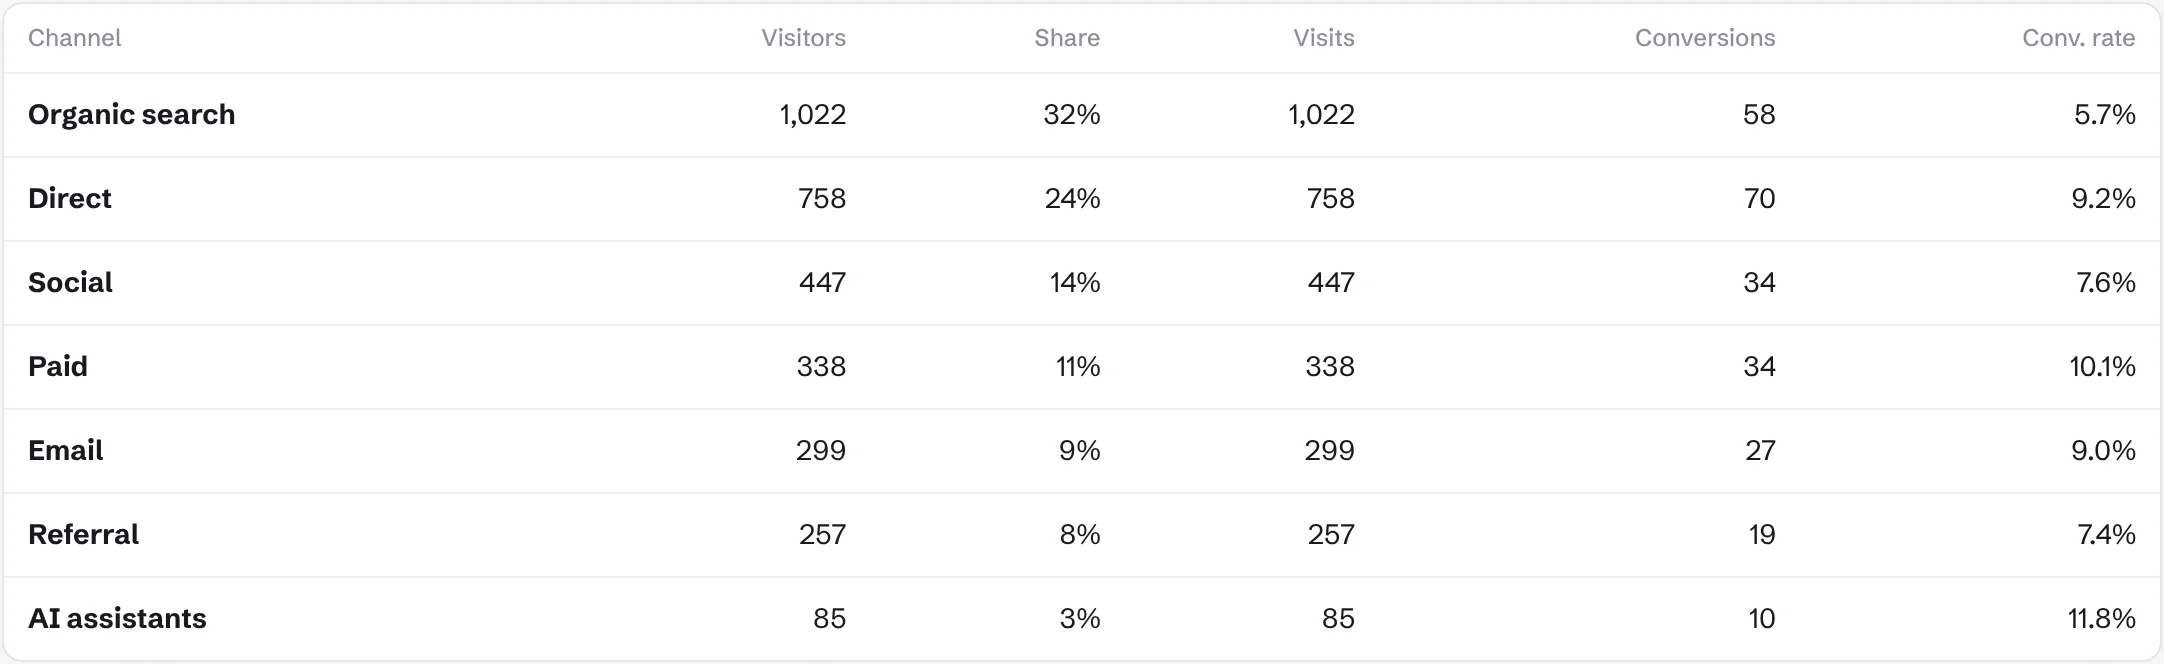
ChatGPT visitors convert twice as often.
People who found the site through AI assistants requested quotes at 11.8%, against 5.7% from Google search.
One line of code.
Paste it in your header. Clicks, calls and form submissions are tracked automatically.
<script defer data-site="pv_yoursite" src="https://seeplainview.com/t.js"></script>
No cookie banner
No cookies, no stored IP addresses.
About 3 KB
Loads after your page, never slows it down.
Your data
Never sold. Export it any time.
Find out where your site loses people.
Plans from $29 a month. Try it free for 14 days.